
[Prometheus từ A đến Z] Phần 06. Giám sát Vmware với Prometheus
Bài viết chỉ mang tính chất tham khảo và chia sẻ, các trong quá trình làm chắc chắn sẽ có bạn gặp bug. Nếu gặp bug thì vào telegram group ITFORVN để nhờ support từ cộng đồng. Hoặc các bạn thể có truy cập vào nguồn tham khảo để làm theo hướng dẫn chính thống. Ngoài ra bạn có thể tham gia Forum Google [prometheus-users] của nước ngoài để hỏi đáp.
Thân chào anh em. Để tiếp tục seri chia sẻ về Promehtues và Grafana. Hôm nay mình xin chia sẻ với mọi người cách giám sát các Vmware với Prometheus. Để giám sát được các ESXi host hoặc vCenter chúng ta cần cài vmware_exporter trên prometheus server.
Bước 01: Cài đặt python 3.x bởi vì vmware-exporter yêu cầu Python >= 3.6
wget https://www.python.org/ftp/python/3.6.4/Python-3.6.4.tar.xz
tar -xJf Python-3.6.4.tar.xz
cd Python-3.6.4
./configure
make
make install
pip3 install --upgrade pip
Bước 02: Cài đặt vmware_exporter
pip3 install vmware_exporterSau khi cài đặt xong, đường dẫn lưu trử tại đây.
/usr/local/lib/python3.6/site-packages/vmware_exporter
Trong trường hợp không có trong đường dẫn này thì bạn có thể sử dụng câu lệnh sau để tìm:
find / -name "vmware_exporter"Bước 03: Tạo user read-only dùng để monitor trên vcenter hoặc ESXi host.
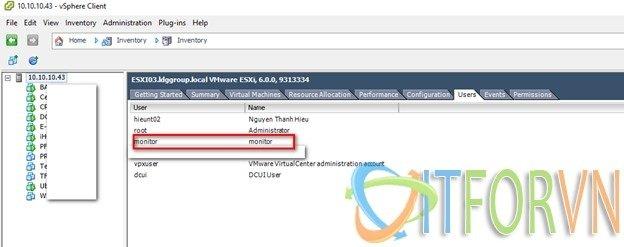
Hình 01: [Promethues từ A đến Z] Phần 06. Giám sát Vmware với Prometheus
Bước 04: Tạo file cấu hình cho vmware_exporter
cd /usr/local/lib/python3.6/site-packages/vmware_exporter
vi config.yml
Nội dung file config như sau:
default:
    vsphere_host: 10.10.10.43
    vsphere_user: 'monitor'
    vsphere_password: 'abc@123'
    ignore_ssl: True
    specs_size: 5000
    collect_only:
        vms: True
        vmguests: False
        datastores: True
        hosts: True
        snapshots: True
esxi02:
    vsphere_host: 10.10.10.41
    vsphere_user: 'monitor'
    vsphere_password: 'abc@123'
    ignore_ssl: True
    specs_size: 5000
    collect_only:
        vms: True
        vmguests: False
        datastores: True
        hosts: True
        snapshots: True
esxi01:
    vsphere_host: 10.10.10.40
    vsphere_user: 'monitor'
    vsphere_password: 'abc@123'
    ignore_ssl: True
    specs_size: 5000
    collect_only:
        vms: True
        vmguests: False
        datastores: True
        hosts: True
snapshots: False- Nếu bạn có nhiều vCenter hoặc ESXi host thì bạn có thể add thêm như highlight ở trên.
Bước 05: Tạo service trong systemd cho vmware_exporter
vi /etc/systemd/system vmware_exporter.serviceNội dung file như sau:
[Unit]
Description=Prometheus VMWare Exporter
After=network.target
[Service]
User=root
Group=root
ExecStart=/usr/bin/python3 /usr/local/bin/vmware_exporter -c /usr/local/lib/python3.6/site-packages/vmware_exporter/config.yml
Type=simple
[Install]
WantedBy=multi-user.target
Bước 06: Enable và start service
systemctl enable vmware_exporter.service
systemctl start vmware_exporter.service
Bước 07: Tạo job trong prometheus để giám sát Vmware. Đối với vmware để lấy dc metric của nhiều host ESXi thì chúng ta phải tạo nhiều job. Bạn nào có cách khác hay hơn thì chỉ lại mình nhé. Nội dung job như sau:
################################ VMWARWE
  - job_name: 'ESXi03'
    metrics_path: '/metrics'
    static_configs:
      - targets:
        - 10.10.10.43
        labels:
         hostname: ESXi03
         device: VMWARE
         company: ITFORVN
    params:
      section: [default]
    relabel_configs:
      - source_labels: [__address__]
        target_label: __param_target
      - source_labels: [__param_target]
        target_label: instance
      - target_label: __address__
        replacement: 10.10.10.26:9272
  - job_name: 'ESXi02'
    metrics_path: '/metrics'
    static_configs:
      - targets:
        - 10.10.10.41
        labels:
         hostname: ESXi02
         device: VMWARE
         company: ITFORVN
    params:
      section: [esxi02]
    relabel_configs:
      - source_labels: [__address__]
        target_label: __param_target
      - source_labels: [__param_target]
        target_label: instance
      - target_label: __address__
        replacement: 10.10.10.26:9272
  - job_name: 'ESXi01'
    metrics_path: '/metrics'
    static_configs:
      - targets:
        - 10.10.10.40
        labels:
         hostname: ESXi01
         device: VMWARE
         company: ITFORVN
    params:
      section: [esxi01]
    relabel_configs:
      - source_labels: [__address__]
        target_label: __param_target
      - source_labels: [__param_target]
        target_label: instance
      - target_label: __address__
        replacement: 10.10.10.26:9272
Bước 08: Restart prometheus service và kiểm tra lại kết quả
Tại đây bạn phải nhớ mở port 9272 nhé.
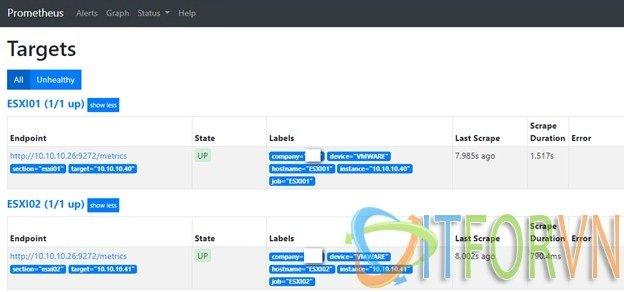
Hình 02: [Promethues từ A đến Z] Phần 06. Giám sát Vmware với Prometheus
Chọn vào 1 job để kiểm tra metric.
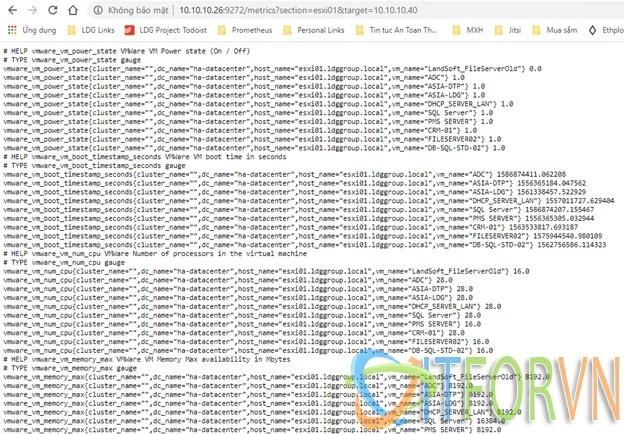
Hình 03: [Promethues từ A đến Z] Phần 06. Giám sát Vmware với Prometheus
Bước 09: Đăng nhập vào grafana tạo dashboard
Cách tạo dashboard trong grafana mình có hướng dẫn tại Bước 09 trong bài viết này.
Đây là dashboard của linux server sau khi đã import xong.
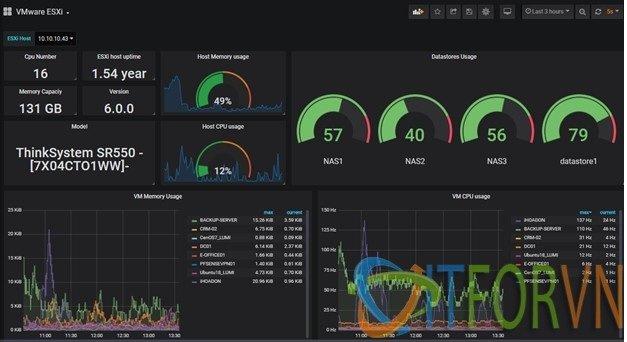
Hình 04: [Promethues từ A đến Z] Phần 06. Giám sát Vmware với Prometheus
Đây là dashboard EXSi host của mình bạn có thể download tại đây.
Về dashboard bạn có thể tham khảo thêm tại đây nhé. https://grafana.com/grafana/dashboards
Tài liệu tham khảo: https://github.com/pryorda/vmware_exporter
Tác giả: Nguyễn Hiếu – ITFORVN.COM
To you support to access: Nhóm Facebook ITFORVN
Tất cả bài viết về prometheus tại đây.
Giới thiệu về giải pháp giám sát hệ thống Prometheus và Grafana
Phần 01 – Cài đặt Prometheus và Grafana trên CentOS 07
Phần 02 – Giám sát Windows Server với Prometheus
Phần 03 – Giám sát firewall Fortigate với Prometheus
Phần 04 – Giám sát thiết bị mạng Cisco với Prometheus
Phần 05 – Giám sát firewall pfSense® và Linux Server với Prometheus
Phần 06 – Giám sát VMWARE với Prometheus
Phần 07 – Cấu hình alert trong Prometheus và gửi tin nhắn qua telegram