[Prometheus từ A đến Z] Phần 07. Cấu hình Alert trong Prometheus gửi tin nhắn qua telegram
![[Prometheus từ A đến Z] Phần 07. Cấu hình Alert trong Prometheus gửi tin nhắn qua telegram](/uploads/2020/05/14.jpg)
Bài viết chỉ mang tính chất tham khảo và chia sẻ, các trong quá trình làm chắc chắn sẽ có bạn gặp bug. Nếu gặp bug thì vào telegram group ITFORVN để nhờ support từ cộng đồng. Hoặc các bạn thể có truy cập vào nguồn tham khảo để làm theo hướng dẫn chính thống. Ngoài ra bạn có thể tham gia Forum Google [prometheus-users] của nước ngoài để hỏi đáp.
Thân chào các anh em ITFORVN. Đây là bài cuối cùng trong seri chia sẻ về Promehtues và Grafana. Hôm nay mình chia sẻ đến các bạn cách giám cấu hình Alert trong Prometheus và sử dụng telegram để làm công cụ gửi tin nhắn cảnh báo. Mình cảm thấy alert qua email hơi phiền vì phải nhận nhiều mail spam và thấy rằng vì telegram hiện tại rất thông dụng với mọi người và hầu như ai cũng có sử dụng telegram. Chính vì thế mình muốn hướng dẫn các bạn nhận các alert của hệ thống qua telegram cho tiện. Cuối bài là link download các rule mà mình đã edit. Anh em nào cần thì cứ download về sử dụng nhé.
Bước 01: Đầu tiên chúng ta sẽ download source cài đặt vào trong server
wget https://github.com/prometheus/alertmanager/releases/download/v0.20.0/alertmanager-0.20.0.linux-amd64.tar.gz
Bước 02: Giải nén và copy vào thư mục /usr/local để dễ dàng quản lý
tar -xvzf alertmanager-0.20.0.linux-amd64.tar.gz
mv alertmanager-0.20.0.linux-amd64 /usr/local/alertmanager
Bước 03: Tạo service trong systemd cho alertmanager
vi /etc/systemd/system/alertmanager.service
Nội dung file service như sau:
[Unit]
Description=AlertManager
Wants=network-online.target
After=network-online.target

[Service]
User=root
Group=root
Type=simple
ExecStart=/usr/local/alertmanager/alertmanager \
--config.file=/usr/local/alertmanager/alertmanager.yml
[Install]
WantedBy=multi-user.target
Enable và start service
systemctl daemon-reload
systemctl enable alertmanager
systemctl restart alertmanager
Bước 04: Cấu hình alert trong prometheus
vi /usr/local/prometheus/prometheus.yml
Tại targets: nhập thông tin ip, port , tại đây chính là ip của prometheus server và port 9093 (alertmanager dùng port này).
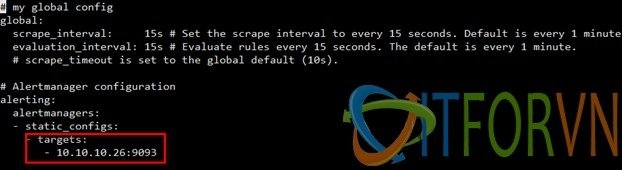
Hình 01: [Promethues từ A đến Z] Phần 07. Cấu hình Alert trong Prometheus gửi tin nhắn qua telegram
Bước 05: Tạo các rule alert trong prometheus. Để tạo alert trong prometheus, bạn cần phải định nghĩa ra các rule. Tạo các file rule trong thư mục promethues với format sau: rulename.yml
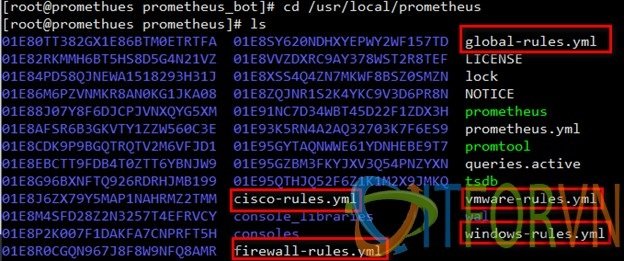
Hình 02: [Promethues từ A đến Z] Phần 07. Cấu hình Alert trong Prometheus gửi tin nhắn qua telegram
Nội dung file rule tùy các bạn định nghĩa. Tại đây mình tạo 1 rule alert cho windows host: windows-rule.yml
vi /usr/local/prometheus/windows-rules.yml
Nội dung file rule như sau:
############# Define Rule Alert ###############
# my global config
############# Define Rule Alert ###############
groups:
- name: Windows-alert
  rules:

################ Memory Usage High
  - alert: Memory Usage High
    expr: 100*(wmi_os_physical_memory_free_bytes) / wmi_cs_physical_memory_bytes > 90
    for: 1m
    labels:
      severity: warning
    annotations:
      summary: "Memory Usage (instance {{ $labels.instance }})"
      description: "Memory Usage is more than 90%\n  VALUE = {{ $value }}\n  LABELS: {{ $labels }}"

################ CPU Usage High
  - alert: Cpu Usage High
    expr: 100 - (avg by (instance) (irate(wmi_cpu_time_total{mode="idle"}[2m])) * 100) > 80
    for: 1m
    labels:
      severity: warning
    annotations:
      summary: "CPU Usage (instance {{ $labels.instance }})"
      description: "CPU Usage is more than 80%\n  VALUE = {{ $value }}\n  LABELS: {{ $labels }}"

################ Disk Usage
  - alert: DiskSpaceUsage
    expr: 100.0 - 100 * ((wmi_logical_disk_free_bytes{} / 1024 / 1024 ) / (wmi_logical_disk_size_bytes{}  / 1024 / 1024)) > 95
    for: 1m
    labels:
      severity: error
    annotations:
      summary: "Disk Space Usage (instance {{ $labels.instance }})"
      description: "Disk Space on Drive is used more than 95%\n  VALUE = {{ $value }}\n  LABELS: {{ $labels }}"

################ ServiceStatus
  - alert: ServiceStatus
    expr: wmi_service_status{status="ok"} != 1
    for: 1m
    labels:
      severity: error
    annotations:
      summary: "Service Status (instance {{ $labels.instance }})"
      description: "Windows Service state is not OK\n  VALUE = {{ $value }}\n  LABELS: {{ $labels }}"

################ CollectorError
  - alert: CollectorError
    expr: wmi_exporter_collector_success == 0
    for: 1m
    labels:
      severity: error
    annotations:
      summary: "Collector Error (instance {{ $labels.instance }})"
      description: "Collector {{ $labels.collector }} was not successful\n  VALUE = {{ $value }}\n  LABELS: {{ $labels }}"
Bước 06: Tiếp tục chúng ta sẽ khai báo tên của rule đó vào cấu hình của prometheus theo như hình bên dưới.
vi /usr/local/prometheus/prometheus.yml
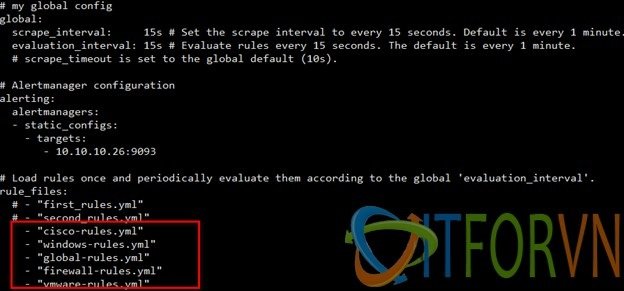
Hình 03: [Promethues từ A đến Z] Phần 07. Cấu hình Alert trong Prometheus gửi tin nhắn qua telegram
Bước 07: Kiểm tra lại rule đã tạo bằng lệnh sau
./promtool check config prometheus.yml
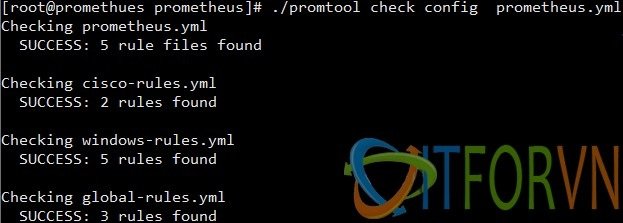
Hình 04: [Promethues từ A đến Z] Phần 07. Cấu hình Alert trong Prometheus gửi tin nhắn qua telegram
Bước 08: Restart prometheus service và kiểm tra lại kết quả:
Hình 05: [Promethues từ A đến Z] Phần 07. Cấu hình Alert trong Prometheus gửi tin nhắn qua telegram
Tương tự bạn sẽ tạo nhiều rule cho nhiều nhóm thiết bị khác nhau. Bước 09: Ở bước này mình sẽ tạo 1 con telegram_bot sau đó gửi alert qua telegram. Download source code và build file binary
cd ${GOPATH-$HOME/go}/src/github.com
go get github.com/inCaller/prometheus_bot
cd ${GOPATH-$HOME/go}/src/github.com/inCaller/prometheus_bot
make clean
make
Copy bỏ vào thư mục /usr/local để dễ dàng quản lý.
mv /root/go/src/github.com/inCaller/prometheus_bot /usr/local
Đăng nhập vào telegram để tạo telegram bot và group nhận alert.
Cách tạo telegram bot tham khảo tại đây https://www.teleme.io/articles/create_your_own_telegram_bot?hl=vi
Khi tạo telegram bot mình sẽ ghi lại token của con bot, dùng để điền vào file config.yaml mà chúng ta tạo sau đó.
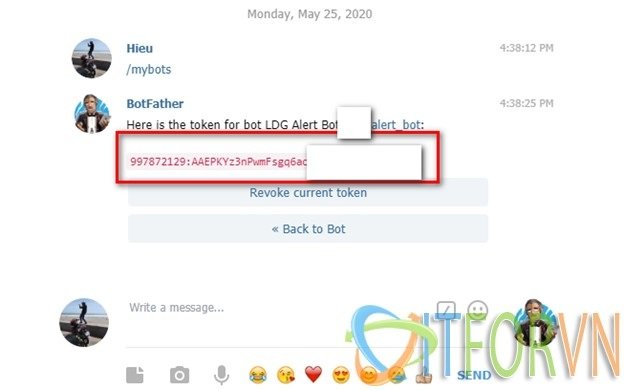 Hình 06: [Promethues từ A đến Z] Phần 07. Cấu hình Alert trong Prometheus gửi tin nhắn qua telegram
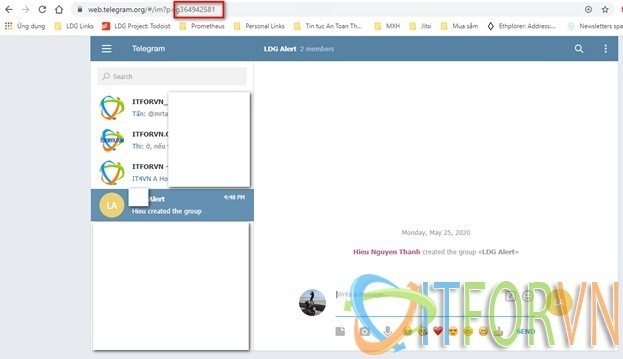
Tiếp tục tạo group sau đó add bot vừa tạo vào, sử dụng telegram qua web bạn sẽ lấy dc tham số -chat-id
Chat-id chính là : g364942581
Hình 06: [Promethues từ A đến Z] Phần 07. Cấu hình Alert trong Prometheus gửi tin nhắn qua telegram
Tiếp tục tạo group sau đó add bot vừa tạo vào, sử dụng telegram qua web bạn sẽ lấy dc tham số -chat-id
Chat-id chính là : g364942581
Hình 07: [Promethues từ A đến Z] Phần 07. Cấu hình Alert trong Prometheus gửi tin nhắn qua telegram
Bước 10: Tạo file cấu hình của prometheus_bot
vi /usr/local/prometheus_bot/config.yaml
Nội dung file config.yaml như sau:
telegram_token: "997872129:AAEPKYz3nPwmFsgq6ao-MdPsC5fy5z376GQ"

# ONLY IF YOU USING TEMPLATE required for test
template_path: "template.tmpl"
time_zone: "Asia/Ho_Chi_Minh"
split_token: "|"

# ONLY IF YOU USING DATA FORMATTING FUNCTION, NOTE for developer: important or test fail
time_outdata: "02/01/2006 15:04:05"
split_msg_byte: 4000
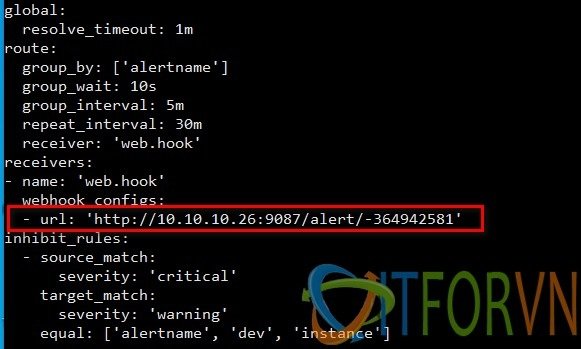
Bước 11: Tiếp tục cấu hình alert manager
vi /usr/local/alertmanager/alertmanager.yml
Thay đổi tham số url như sau: http://ipalertmanager:9087/alert/-chat_id
Bạn có thể edit lại các tham số thời gian. Tại config này mình đang để 30 phút sẽ gửi tin nhắn 1 lần nếu còn alert.
Hình 08: [Promethues từ A đến Z] Phần 07. Cấu hình Alert trong Prometheus gửi tin nhắn qua telegram
Bước 12: Thực hiện test gửi nhận tin nhắn trên telegram với telegram_bot với cú pháp sau:
export TELEGRAM_CHATID="-364942581"
make test
Kiểm tra thấy bot đã gửi được tin nhắn
Hình 09: [Promethues từ A đến Z] Phần 07. Cấu hình Alert trong Prometheus gửi tin nhắn qua telegram
Bước 12: Tiếp tục tạo templet gửi alert trong prometheus.
Trong thư mục testdata có nhiều templet cho bạn sử dụng, thường mình dùng templet production_example.tmpl
 Hình 10: [Promethues từ A đến Z] Phần 07. Cấu hình Alert trong Prometheus gửi tin nhắn qua telegram
Copy templet ra ngoài thư mục prometheus_bot và đổi tên thành templet.tmpl
Hình 10: [Promethues từ A đến Z] Phần 07. Cấu hình Alert trong Prometheus gửi tin nhắn qua telegram
Copy templet ra ngoài thư mục prometheus_bot và đổi tên thành templet.tmpl
cp production_example.tmpl /usr/local/prometheus_bot/template.tmpl
Tiếp tục edit lại tên của template trong config.yaml của prometheus_bot
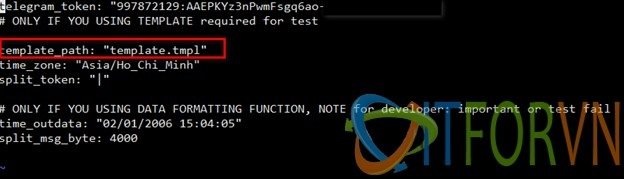 Hình 11: [Promethues từ A đến Z] Phần 07. Cấu hình Alert trong Prometheus gửi tin nhắn qua telegram
Restart lại tất cả services đã cấu hình.
Hình 11: [Promethues từ A đến Z] Phần 07. Cấu hình Alert trong Prometheus gửi tin nhắn qua telegram
Restart lại tất cả services đã cấu hình.
service prometheus_bot restart
service alertmanager restart
service prometheus restart
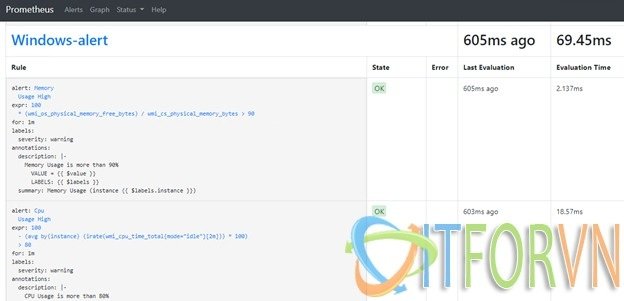
Kiểm tra lại kết quả của alertmanager truy cập vào Prometheus/Alert
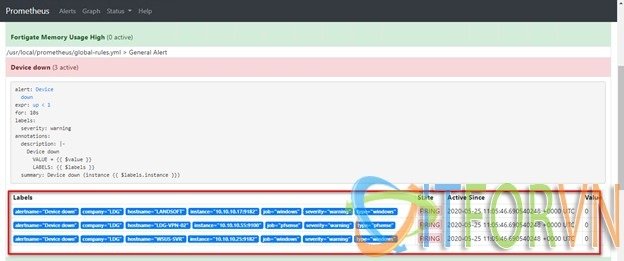 Hình 12: [Promethues từ A đến Z] Phần 07. Cấu hình Alert trong Prometheus gửi tin nhắn qua telegram
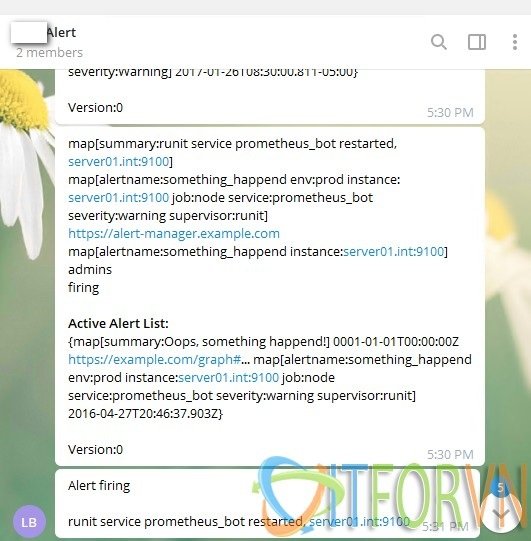
Kết quả telegram_bot gửi tin nhắn alert
Hình 13: [Promethues từ A đến Z] Phần 07. Cấu hình Alert trong Prometheus gửi tin nhắn qua telegram
Hình 12: [Promethues từ A đến Z] Phần 07. Cấu hình Alert trong Prometheus gửi tin nhắn qua telegram
Kết quả telegram_bot gửi tin nhắn alert
Hình 13: [Promethues từ A đến Z] Phần 07. Cấu hình Alert trong Prometheus gửi tin nhắn qua telegram
Mình hy vọng rằng sau seri này các bạn có thể xây dựng một hệ thống monitor tập trung hoàn chỉnh và mở rộng ra hơn giám sát nhiều thứ hơn những cái của mình đã viết ở đây.
Các bạn có thể download các rule alert của mình đã định nghĩa về sử dụng nhé links.
Tài liệu tham khảo:
https://github.com/pryorda/vmware_exporter https://prometheus.io/docs/alerting/alertmanager https://awesome-prometheus-alerts.grep.to
Tác giả: Nguyễn Hiếu – ITFORVN.COM
To you support to access: Nhóm Facebook ITFORVN
Tất cả bài viết về prometheus tại đây. Giới thiệu về giải pháp giám sát hệ thống Prometheus và Grafana Phần 01 - Cài đặt Prometheus và Grafana trên CentOS 07 Phần 02 - Giám sát Windows Server với Prometheus Phần 03 - Giám sát firewall Fortigate với Prometheus Phần 04 - Giám sát thiết bị mạng Cisco với Prometheus Phần 05 - Giám sát firewall pfSense® và Linux Server với Prometheus Phần 06 - Giám sát VMWARE với Prometheus Phần 07 - Cấu hình alert trong Prometheus và gửi tin nhắn qua telegram