Thứ Năm, Tháng Năm 19, 2022
ITFORVN.COM
  • Cloud Computing
    • Azure
    • AWS
    • GCP
    • Cloud Other
  • System
    • Virtualization
    • Microsoft
    • Linux/Unix
    • Databases
    • Monitoring
    • Logging
  • Networking
    • Routing
    • Switch
    • Firewall
  • Security
    • SIEM
    • CIS
    • Audit
  • DevOps
    • CI/CD
    • Docker
    • K8s
    • IaC
  • Resource
    • Tools
    • Documents
    • Download
ITFORVN.COM

[Prometheus từ A đến Z] Phần 02. Giám sát Windows Server với Prometheus

hieuit1506 bởi hieuit1506
19/05/2020
trong Monitoring
Reading Time: 8 mins read
A A
0
Trang chủ System Monitoring
0
Chia sẻ
7.1k
xem
Share on FacebookShare on Twitter

Bài viết chỉ mang tính chất tham khảo và chia sẻ, các trong quá trình làm chắc chắn sẽ có bạn gặp bug. Nếu gặp bug thì vào telegram group ITFORVN để nhờ support từ cộng đồng. Hoặc các bạn thể có truy cập vào nguồn tham khảo để làm theo hướng dẫn chính thống. Ngoài ra bạn có thể tham gia Forum Google [prometheus-users] của nước ngoài để hỏi đáp. 


Thân chào 500 anh em đã ủng hộ mình và ITFORVN trong suốt thời gian qua. Để tiếp nối cho cao trào giám sát hệ thống CNTT với Prometheus và Grafana đình đám trong thời gian qua. Mình sẽ cố gắng đi hết seri bài viết này trong tháng 05 này.

Hôm nay mình xin chia sẽ lại anh em cách để giảm sát tài nguyên và các dịch vụ trên Windows Server bằng Promethues và Grafana. Bên dưới mình có đính kèm các dashboard mình đã edit sẵn, nếu anh em thích cứ lấy về dùng nhé

Để giảm sát được các server Windows, chúng ta cần phải cài đặt wmi_exporter (Agent collectors) để Promethues có thể thu thập được metric từ các server Windows này.

1 - [Prometheus từ A đến Z] Phần 02. Giám sát Windows Server với Prometheus

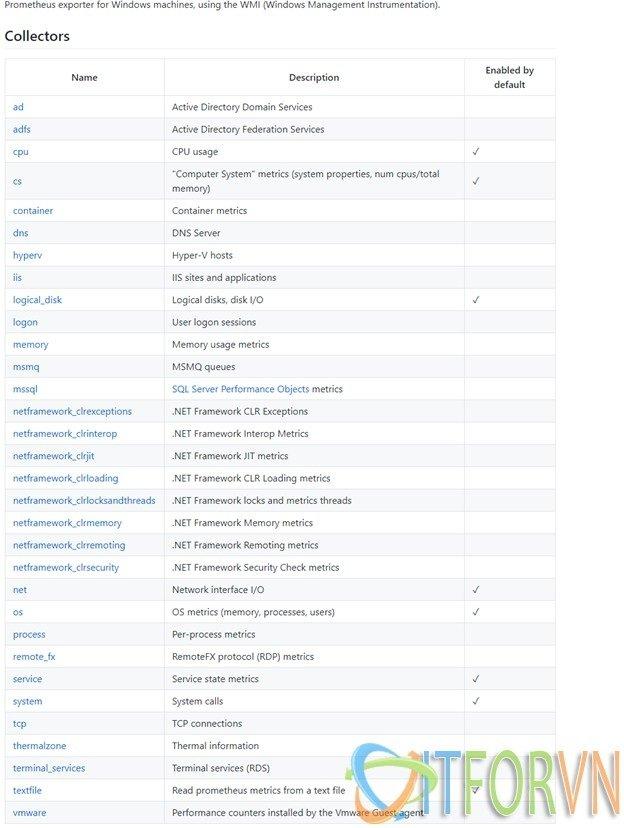
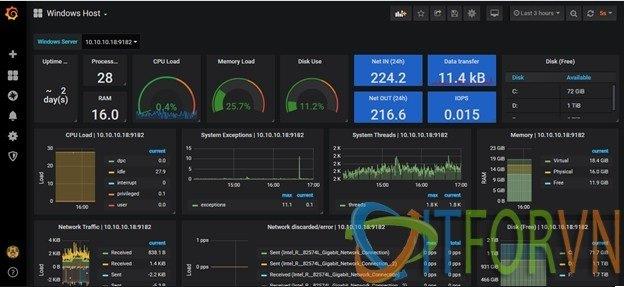
Hình 01: [Prometheus từ A đến Z] Phần 02. Giám sát tài nguyên và dịch vụ trên Windows Server

Nếu các bạn chỉ đơn thuần download các agent này cài đặt vào máy chủ Windows thì bạn chỉ có thể thu thập metric ở mức cơ bản, như hình ở bên trên. Dưới dây là hướng dẫn bạn thu thập metric của những services nâng cao cho service Windows. Ví dụ như: AD, DNS, SQL, IIS, …

Bước 1: Download wmi_exporter (bản mới nhất thì nó sẽ được đổi tên thành windows_exporter). Anh em chú ý để edit trong file dashboard nha. 

Link download Agent: https://github.com/martinlindhe/wmi_exporter/releases

Có 2 phiên bản Agent:

wmi_exporter.exe (click to run, dành cho các bạn nào chỉ cần các metric được enable sẵn).

wmi_exporter.msi (dùng để cài đặt thông qua CMD, enable các tính năng thu thập metric nâng cao).

Khi cài agent qua CMD sẽ giúp các bạn chọn lọc thu thập những loại metric nào cần thu thập, giảm các loại metric không cần thiết, có thể thu thập nhiều loại metric hơn mặc định.

Mở port 9182 trên server linux, và windows server.

Bước 2: Mở CMD với quyền Administrator.

Bước 3: Chạy comment msiexec với cú pháp như sau:

msiexec /i C:\wmi_exporter-0.9.0-amd64.msi ENABLED_COLLECTORS="ad,cpu,cs,logon,memory,logical_disk,os,service,system,process,tcp,net,textfile,thermalzone"

Trong đó C:\wmi_exporter-0.9.0-amd64.msi là đường dẫn chứa file wmi_exporter.msi.

ENABLED_COLLECTORS=”các loại metric cần thu thập, tên của loại metric trong hình bên trên”

Tùy theo từng loại windows server mà lựa chọn metric cho phù hợp.

Bước 4: Kết quả sau khi cài đặt xong:

2 - [Prometheus từ A đến Z] Phần 02. Giám sát Windows Server với Prometheus

Hình 02: [Prometheus từ A đến Z] Phần 02. Giám sát tài nguyên và dịch vụ trên Windows Server

Bước 5: Kiểm tra metric bạn truy cập như sau: http://ipserver:9182

3 - [Prometheus từ A đến Z] Phần 02. Giám sát Windows Server với Prometheus

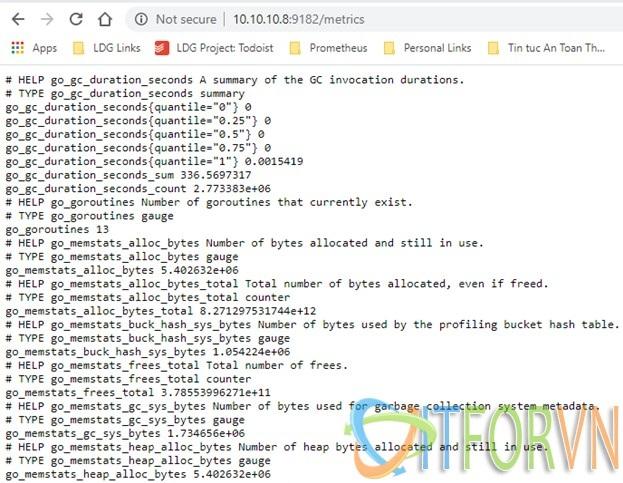
Hình 03: [Prometheus từ A đến Z] Phần 02. Giám sát tài nguyên và dịch vụ trên Windows Server

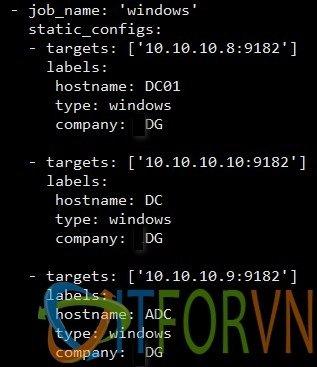
Bước 6: Tạo job trong prometheus để giám sát Windows Server này với nội dung sau:

nano /usr/local/prometheus/prometheus.yml

Nội như sau:

  - job_name: 'windows'
    static_configs:
    - targets: ['10.10.10.8:9182']
      labels:                           
       hostname: DC01
       type: windows
       company: XYZDG

Tại đây mình thêm trường labels vào để dễ dàng filter metric.

Tương tự nếu bạn muốn add nhiều server windows trên cùng 1 job, bạn chỉ cần copy đoạn target và edit lại thông tin.

4 - [Prometheus từ A đến Z] Phần 02. Giám sát Windows Server với Prometheus

Hình 04: [Prometheus từ A đến Z] Phần 02. Giám sát tài nguyên và dịch vụ trên Windows Server

Bước 7: Restart serivce prometheus

systemctl restart prometheus
systemctl status prometheus

Bước 8: Kiểm tra lại host được thêm vào prometheus thành công hay không.

Truy cập vào Prometheus sau đó chọn Status, target để kiểm tra.

5 - [Prometheus từ A đến Z] Phần 02. Giám sát Windows Server với Prometheus

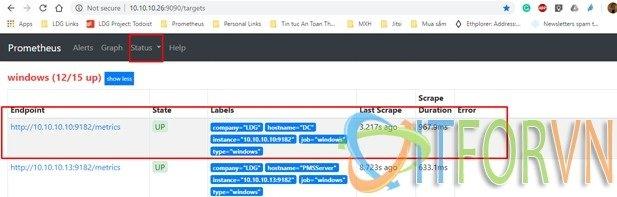
Hình 05: [Prometheus từ A đến Z] Phần 02. Giám sát tài nguyên và dịch vụ trên Windows Server

Bước 9: Tạo Dashboard monitor Windows server trên Grafana.
Truy cập vào Grafana, sau đó chọn Manage Dashboards như hình:

6 - [Prometheus từ A đến Z] Phần 02. Giám sát Windows Server với Prometheus

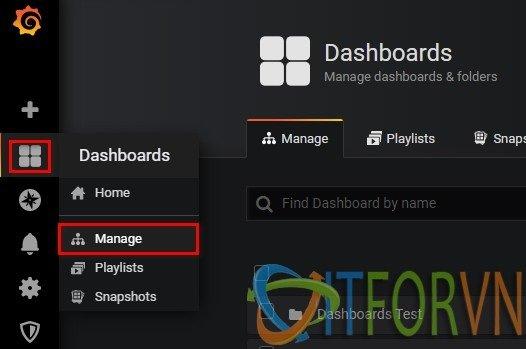
Hình 06: [Prometheus từ A đến Z] Phần 02. Giám sát tài nguyên và dịch vụ trên Windows Server

Tại đây bạn có thể chọn New Dashboard để tạo mới (làm họa sĩ vẽ dashboard) hoặc Import (sử dụng những dashboard có sẳn rồi edit lại cho phù hợp). Tại đây chúng ta chọn Import.

7 - [Prometheus từ A đến Z] Phần 02. Giám sát Windows Server với Prometheus

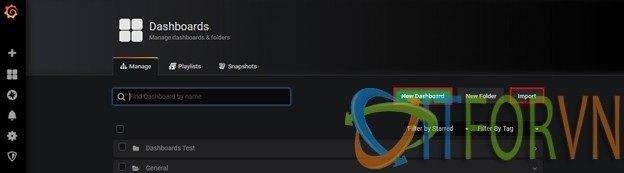
Hình 07: [Prometheus từ A đến Z] Phần 02. Giám sát tài nguyên và dịch vụ trên Windows Server

Tiếp tục chọn vào Upload .json file để import dashboard

8 - [Prometheus từ A đến Z] Phần 02. Giám sát Windows Server với Prometheus

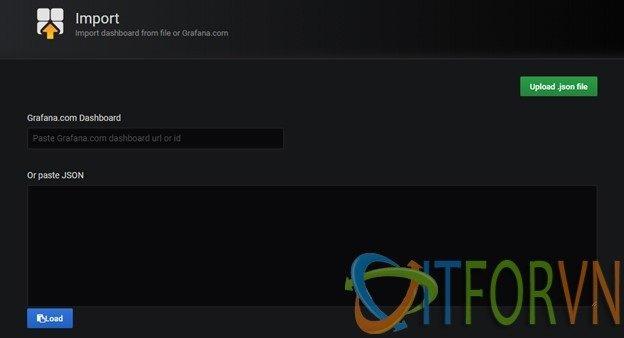
Hình 08: [Prometheus từ A đến Z] Phần 02. Giám sát tài nguyên và dịch vụ trên Windows Server

Sau khi chọn file cần import bạn cần chú ý các tham số sau:

Name : tên của dashboard.

Folder : thư mục chứa dashboard.

UID : số định danh của dashboard, nếu số này trùng thì khi bạn import dashboard củ sẽ bị ghi đè.

9 - [Prometheus từ A đến Z] Phần 02. Giám sát Windows Server với Prometheus

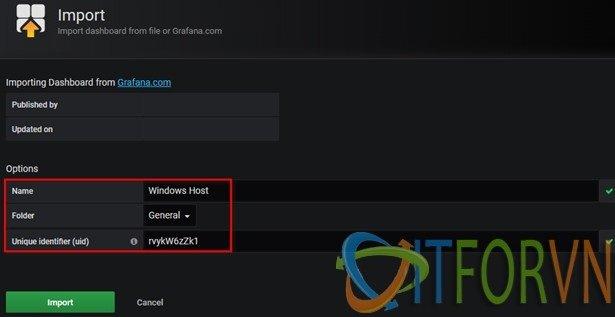
Hình 09: [Prometheus từ A đến Z] Phần 02. Giám sát tài nguyên và dịch vụ trên Windows Server

Đây là kết quả sau khi bạn import dashboard thành công.

10 - [Prometheus từ A đến Z] Phần 02. Giám sát Windows Server với Prometheus

Hình 10: [Prometheus từ A đến Z] Phần 02. Giám sát tài nguyên và dịch vụ trên Windows Server

Như vậy chúng ta có thể ứng dụng hướng dẫn này để giám sát dịch vụ AD, DNS, SQL, IIS, … 

Bonus cho các bạn 2 dashboard  của mình về AD, DNS và SQL

2020 05 19 104146 - [Prometheus từ A đến Z] Phần 02. Giám sát Windows Server với Prometheus

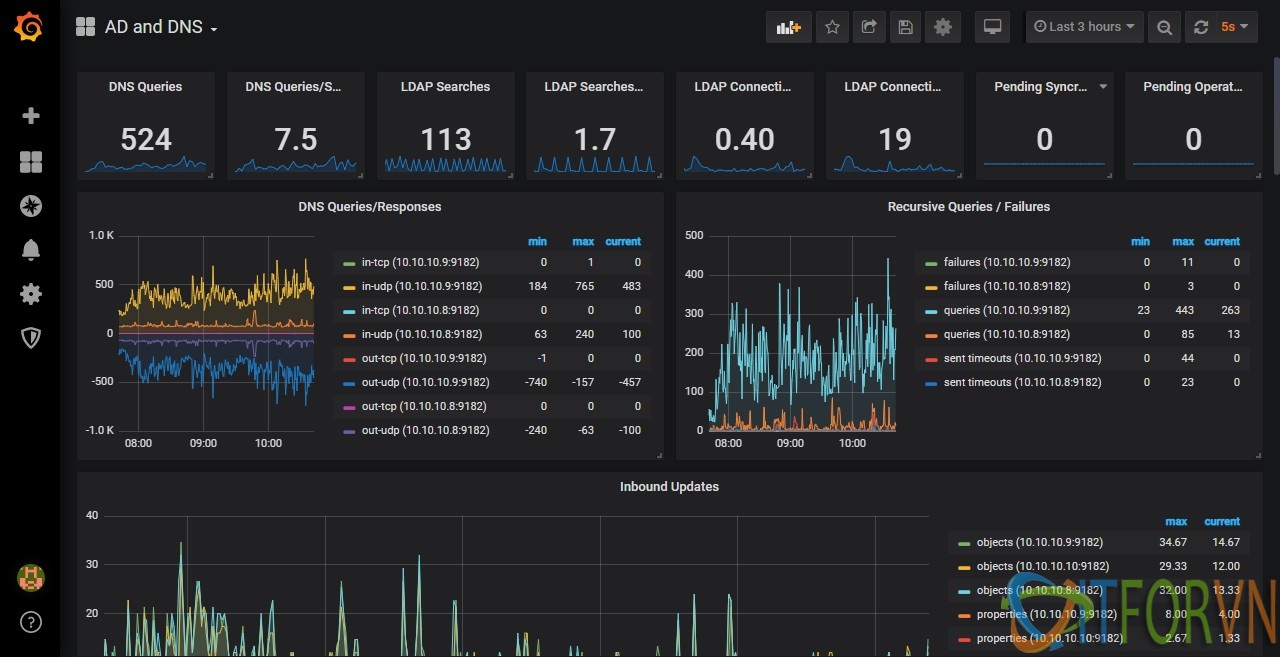
Hình 11: [Prometheus từ A đến Z] Phần 02. Giám sát tài nguyên và dịch vụ trên Windows Servera

2020 05 19 104157 - [Prometheus từ A đến Z] Phần 02. Giám sát Windows Server với Prometheus

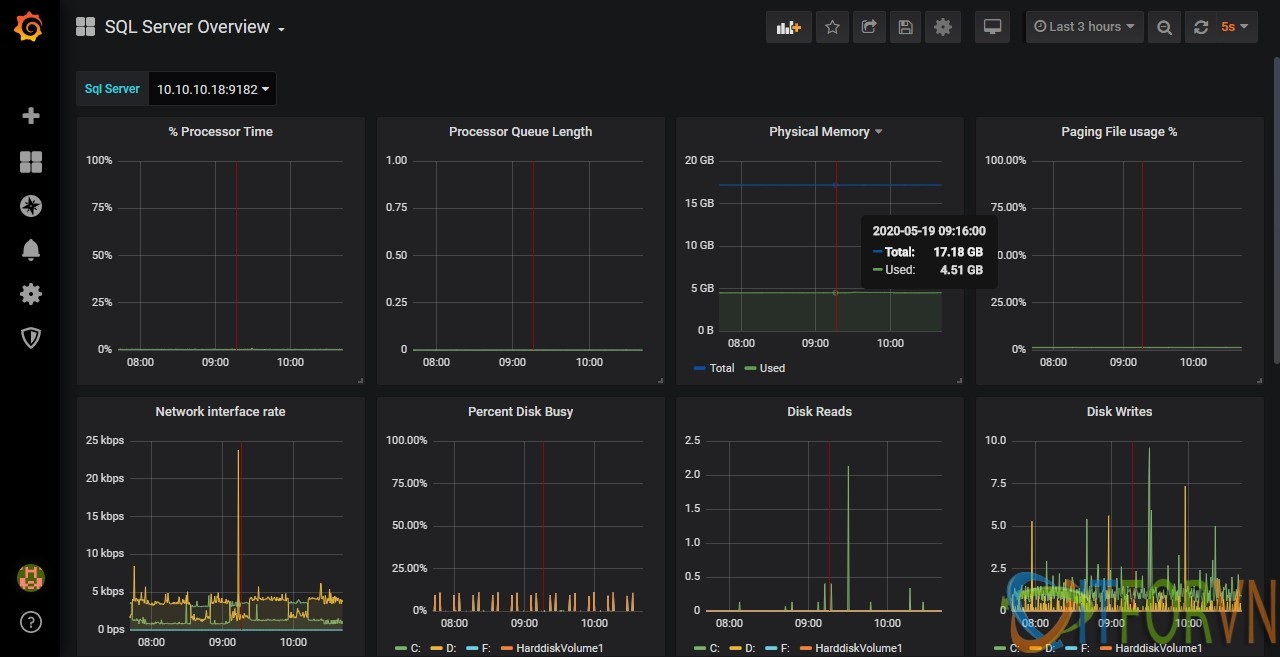
Hình 12: [Prometheus từ A đến Z] Phần 02. Giám sát tài nguyên và dịch vụ trên Windows Server

Các bạn có thể sử dụng dashboard đã edit của mình https://drive.google.com/drive/folders/1cChzXeqjfCdiUyABYExb0ZYdk6buyfef.

Hoặc download các dashboard tùy ý thích tại đây https://grafana.com/grafana/dashboards?dataSource=prometheus&direction=asc&orderBy=name&search=wmi.


Links tham khảo:

https://github.com/martinlindhe/wmi_exporter 


Tác giả:  Nguyễn Hiếu – ITFORVN.COM

To you support to access:  Nhóm Facebook ITFORVN


Tất cả bài viết về prometheus tại đây.

Giới thiệu về giải pháp giám sát hệ thống Prometheus và Grafana

Phần 01 – Cài đặt Prometheus và Grafana trên CentOS 07

Phần 02 – Giám sát Windows Server với Prometheus

Phần 03 – Giám sát firewall Fortigate với Prometheus

Phần 04 – Giám sát thiết bị mạng Cisco với Prometheus

Phần 05 – Giám sát firewall pfSense® và Linux Server với Prometheus

Phần 06 – Giám sát VMWARE với Prometheus

Phần 07 –  Cấu hình alert trong Prometheus và gửi tin nhắn qua telegram

The: Prometheus
Bài trước

Remote work: RDS vs. VDI vs. VPN

Bài kế tiếp

(Gió mạnh) To be an IT consultant

hieuit1506

hieuit1506

Bài viết liên quan

[Prometheus từ A đến Z] Phần 07. Cấu hình Alert trong Prometheus gửi tin nhắn qua telegram
Monitoring

[Prometheus từ A đến Z] Phần 07. Cấu hình Alert trong Prometheus gửi tin nhắn qua telegram

25/05/2020
[Prometheus từ A đến Z] Phần 06. Giám sát Vmware với Prometheus
Monitoring

[Prometheus từ A đến Z] Phần 06. Giám sát Vmware với Prometheus

25/05/2020
[Prometheus từ A đến Z] Phần 05. Giám sát firewall pFsense và Linux server với Prometheus
Monitoring

[Prometheus từ A đến Z] Phần 05. Giám sát firewall pFsense và Linux server với Prometheus

22/05/2020
Bài kế tiếp
(Gió mạnh) To be an IT consultant

(Gió mạnh) To be an IT consultant

[Prometheus từ A đến Z] Phần 03. Giám sát firewall Fortigate qua snmp với Prometheus

[Prometheus từ A đến Z] Phần 03. Giám sát firewall Fortigate qua snmp với Prometheus

5 4 votes
Article Rating
Subscribe
Connect with
Login
I allow to create an account
When you login first time using a Social Login button, we collect your account public profile information shared by Social Login provider, based on your privacy settings. We also get your email address to automatically create an account for you in our website. Once your account is created, you'll be logged-in to this account.
DisagreeAgree
Notify of
guest
Connect with
I allow to create an account
When you login first time using a Social Login button, we collect your account public profile information shared by Social Login provider, based on your privacy settings. We also get your email address to automatically create an account for you in our website. Once your account is created, you'll be logged-in to this account.
DisagreeAgree
guest
0 Comments
Inline Feedbacks
View all comments

Bài viết hay

Tự Học CCNA Bài 2-Mô hình OSI và TCP/IP

Tự Học CCNA Bài 2-Mô hình OSI và TCP/IP

03/08/2017
Cấu hình IIS frontend và SQL backend với Azure Resource Manager

Cấu hình IIS frontend và SQL backend với Azure Resource Manager

07/05/2017
Zabbix monitoring network 9: Convert character Zabbix Database

Zabbix monitoring network 9: Convert character Zabbix Database

07/06/2021
ITFORVN

KIẾN THỨC LÀ 1 NGỌN LỬA, CHIA SẺ CÀNG NHIỀU NÓ CÀNG BÙNG CHÁY MẠNH

Chuyên mục

  • Audit
  • Azure
  • Backup & Restore
  • CEH
  • Cloud Computing
  • Cloud Other
  • Databases
  • Documents
  • Firewall
  • IaC
  • Khác
  • Linux/Unix
  • Logging
  • Mail Server
  • Microsoft
  • Monitoring
  • Networking
  • Office 365
  • Routing
  • Security
  • Security Awareness
  • Server & Storage
  • SIEM
  • Switch
  • System
  • Tools
  • Virtualization
  • Website

Tags

AD ARM Cacti CCNA Centos Cisco Citrix Controller DLP EIRGP EthernetChannel EVE-NG Exchange Fortinet FreePBX HCIBench HP IBM Installation iRedMail LAB McAfee MCSA Meeting Microsoft Teams Monitoring MSSQL P2S Prometheus SAN Splunk STP TCP/IP Ubuntu VDI Virtual Machine VLAN VMware VPN VTP Windows 10 Windows Server Wireless XPENOLOGY Zabbix

Bài Viết Gần Đây

  • Hướng dẫn cài đặt Windows Subsystem for linux version 2 (WSL2) 14/12/2021
  • Hướng dẫn Active code Azurepass 14/12/2021
  • [Tự học MCSA MCSE 2016]Lab 17 Cấu hình DFS trên Windows Server 2016 phần 1 23/08/2021
  • Zabbix monitoring network 10:Upgrade Zabbix from 4.4 to 5.0 LTS 27/06/2021
  • Zabbix monitoring network 9: Convert character Zabbix Database 07/06/2021
  • Zabbix monitoring network 8: Zabbix Grafana 16/05/2021
  • Zabbix monitoring network 7: Telegram Alert 09/05/2021

© 2021 Cộng Đồng IT Việt - ITFORVN

  • Cloud Computing
    • Azure
    • AWS
    • GCP
    • Cloud Other
  • System
    • Virtualization
    • Microsoft
    • Linux/Unix
    • Databases
    • Monitoring
    • Logging
  • Networking
    • Routing
    • Switch
    • Firewall
  • Security
    • SIEM
    • CIS
    • Audit
  • DevOps
    • CI/CD
    • Docker
    • K8s
    • IaC
  • Resource
    • Tools
    • Documents
    • Download

© 2021 Cộng Đồng IT Việt - ITFORVN

wpDiscuz
0
0
Would love your thoughts, please comment.x
()
x
| Reply
This website uses cookies. By continuing to use this website you are giving consent to cookies being used. Visit our Privacy and Cookie Policy.