
[Prometheus từ A đến Z] Phần 05. Giám sát firewall pFsense và Linux server với Prometheus
Bài viết chỉ mang tính chất tham khảo và chia sẻ, các trong quá trình làm chắc chắn sẽ có bạn gặp bug. Nếu gặp bug thì vào telegram group ITFORVN để nhờ support từ cộng đồng. Hoặc các bạn thể có truy cập vào nguồn tham khảo để làm theo hướng dẫn chính thống. Ngoài ra bạn có thể tham gia Forum Google [prometheus-users] của nước ngoài để hỏi đáp.
Thân chào các đồng đạo ITFORVN. Để tiếp tục seri chia sẻ về Promehtues và Grafana. Hôm nay mình chia sẻ đến các bạn cách giám sát Linux server với Prometheus bằng node_exporter. Ngoài ra trong bài viết này mình còn bonus cho các bạn sử dụng node_exporter để giám sát firewall pFsense.
Trong bài viết này em xin chia làm 2 phần:
Phần 01: Giám sát FreeBDS (pFsense firewall) bằng node_exporter
pFsense là firewall mã nguồn mở chạy trên nền tảng FreeBSD. Chính vì thế chúng ta sẽ cài đặt node_exporter trên pFsense để Prometheus server có thể giám sát được nó.
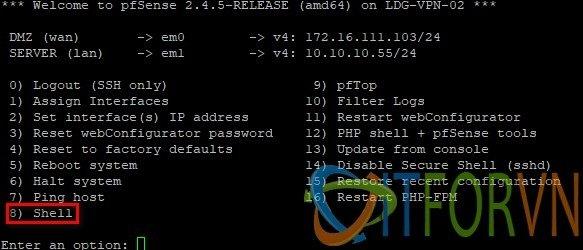
Bước 01: SSH vào pFsense, chọn 8 để vào shell
Bước 02: Cài đặt node_exporter
pkg add http://pkg.freebsd.org/FreeBSD:11:amd64/release_2/All/node_exporter-0.15.2.txzBước 03: Hiệu chỉnh các service trong node_exporter
vi /usr/local/etc/rc.d/node_exporterTìm đến các tham số sau và chỉnh lại như bên dưới:
: ${node_exporter_enable:="YES"}
: ${node_exporter_user:="root"}
: ${node_exporter_group:="root"}
Bước 04: Enable và start node_exporter
/usr/local/etc/rc.d/node_exporter enabled
/usr/local/etc/rc.d/node_exporter start
Kết quả sau khi cài đặt và cấu hình.

Bước 05: Tạo job trong prometheus để giám sát pFsense với nội dung job sau:
################################ pFsense
  - job_name: 'pfsense'
    static_configs:
    - targets: ['10.10.10.54:9100']
      labels:
       hostname: OpenVPN
       type: pfsense
       company: ITFORVN
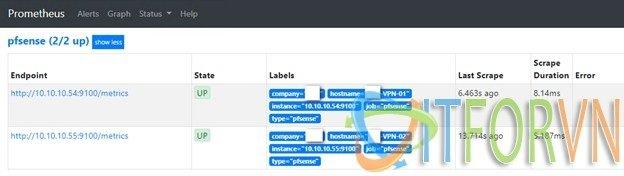
Bước 06: Restart service và kiểm tra lại kết quả
Bạn nhớ phải mở port 9100 cho node_exporter nhé.
Bước 07: Đăng nhập vào Grafana để tạo dashboard để giám sát firewall pFsense
Cách tạo dashboard trong grafana mình có hướng dẫn tại Bước 09 trong bài viết này.
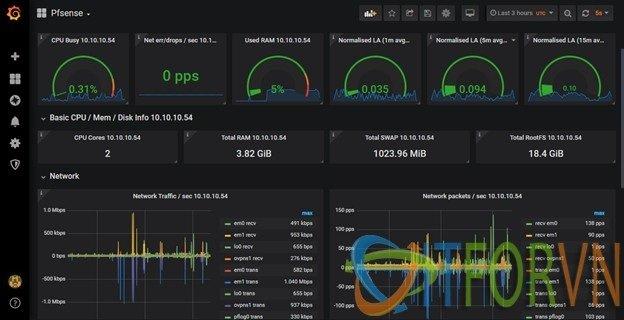
Đây là dashboard của pFsense sau khi mình đã import xong.
Phần 02: Giám sát CentOS, Ubuntu bằng node_exporter
Bước 01: Download node_exporter trên Server cần giám sát.
wget https://github.com/prometheus/node_exporter/releases/download/v1.0.0-rc.1/node_exporter-1.0.0-rc.1.linux-amd64.tar.gzBước 02: Giải nén source code và copy đến đường dẫn sau /usr/local/node_exporter
tar -xvzf node_exporter-1.0.0-rc.1.linux-amd64.tar.gz
mkdir /usr/local/node_exporter
mv node_exporter-1.0.0-rc.1.linux-amd64/node_exporter /usr/local/node_exporter
Bước 03: Tạo service trong systemd cho node_exporter
vim /etc/systemd/system/node_exporter.serviceNội dung trong file như sau:
[Unit]
Description=Node Exporter
Wants=network-online.target
After=network-online.target
[Service]
User=root
ExecStart=/usr/local/node_exporter/node_exporter
[Install]
WantedBy=default.target
Bước 04: Restart và enable service
systemctl daemon-reload
systemctl start node_exporter
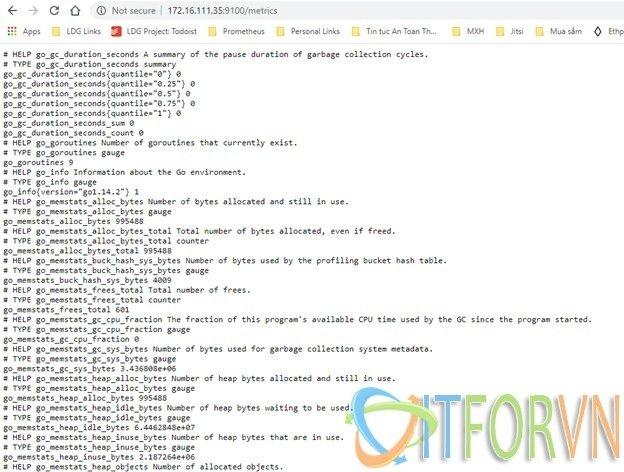
systemctl enable node_exporterBước 05: Truy cập vào node_exporter để kiểm tra
Bước 06: Tạo job trong prometheus để giám sát server Linux này với nội dung job sau:
################################ pFsense
  - job_name: 'pfsense'
    static_configs:
    - targets: ['10.10.10.54:9100']
      labels:
       hostname: Jitsi
       type: linux
       company: ITFORVN
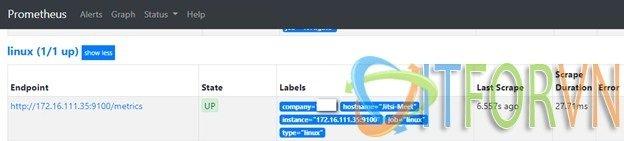
Bước 07: Restart lại prometheus service và kiểm tra kết quả
Bước 08: Đăng nhập vào Grafana để tạo dashboard để giám sát firewall Pfsense
Cách tạo dashboard trong grafana mình có hướng dẫn tại Bước 09 trong bài viết này.
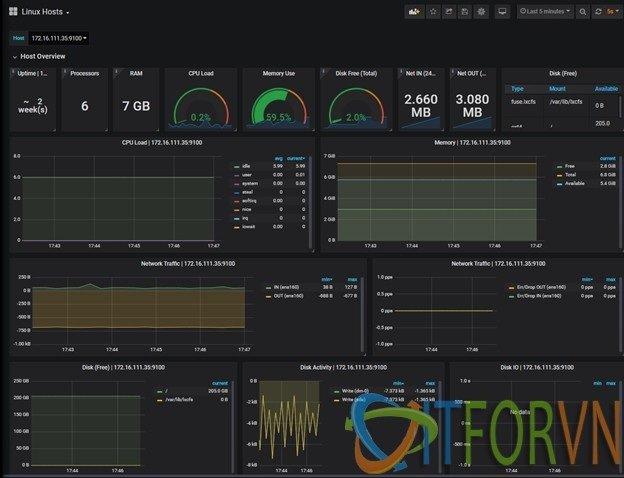
Đây là dashboard của linux server sau khi đã import xong.
Đây là dashboard Pfsense và Linux server của mình bạn có thể download tại đây.
Về dashboard bạn có thể tham khảo thêm tại đây nhé. https://grafana.com/grafana/dashboards
Tác giả: Nguyễn Hiếu – ITFORVN.COM
To you support to access: Nhóm Facebook ITFORVN
Tất cả bài viết về prometheus tại đây.
Giới thiệu về giải pháp giám sát hệ thống Prometheus và Grafana
Phần 01 – Cài đặt Prometheus và Grafana trên CentOS 07
Phần 02 – Giám sát Windows Server với Prometheus
Phần 03 – Giám sát firewall Fortigate với Prometheus
Phần 04 – Giám sát thiết bị mạng Cisco với Prometheus
Phần 05 – Giám sát firewall pfSense® và Linux Server với Prometheus
Phần 06 – Giám sát VMWARE với Prometheus
Phần 07 – Cấu hình alert trong Prometheus và gửi tin nhắn qua telegram