
[Prometheus từ A đến Z] Phần 03. Giám sát firewall Fortigate qua snmp với Prometheus
Bài viết chỉ mang tính chất tham khảo và chia sẻ, các trong quá trình làm chắc chắn sẽ có bạn gặp bug. Nếu gặp bug thì vào telegram group ITFORVN để nhờ support từ cộng đồng. Hoặc các bạn thể có truy cập vào nguồn tham khảo để làm theo hướng dẫn chính thống. Ngoài ra bạn có thể tham gia Forum Google [prometheus-users] của nước ngoài để hỏi đáp.
Thân chào 500 anh ITFORVN, đa phần mọi người mọi nhà đa phần đang sử dụng firewall Fortigate đúng không ạ? Hôm nay em xin chia sẽ với mọi người cách giám sát thiết bị firewall Fortigate này qua snmp với Prometheus và hiển thị lên dashboard của Grafana.
Để giám sát các thiết bị mạng, các hệ thống khác sẽ dựa vào snmp để thu thập metric. Prometheus cũng không ngoại lệ, nó sử dụng snmp_exporter để thu thập metric trên các thiết bị mạng. Do vậy suy ra những gì có snmp thì promethues sẽ thu thập metric được.
Để snmp_exporter hoạt động được, chúng ta cần phải file snmp.yml. Với snmp_exporter nó cung cấp cho chúng ta 1 tool để generate ra file snmp.yml này. Nội dung trong file snmp.yml này chính là các tham số walk và oid của mibs.
Bước 01: Chúng ta cần phải install GoLang để sử dụng SNMP Exporter Config Generator
Link download source GoLang tại đây https://golang.org/dl/
Nói chung với GoLang chỉ cần export đúng là chạy được. Tại đây mình có custom lại một số biến môi trường.
Chúng ta sử dụng wget để download golang về
wget https://dl.google.com/go/go1.12.5.linux-amd64.tar.gzTiếp tục giải nén file vừa download và chuyển nó đến đường dẫn /usr/local/go
tar -xvzf go1.12.5.linux-amd64.tar.gz
mv go /usr/local
Export GOROOT và GOPATH
export GOROOT=/usr/local/go
export GOPATH=$HOME/go
export PATH=$GOPATH/bin:$GOROOT/bin:$PATH
Kiểm tra version GoLang và verify lại cấu hình
go version
go env
Mặc định export không thì GoLang chỉ tồn tại trong 1 shell. Nếu muốn all shell thì phải thêm dòng lệnh export vào .bashrc
vi .bashrcBỏ đoạn export vào cuối file và save lại.
export GOROOT=/usr/local/go
export GOPATH=$HOME/go
export PATH=$GOPATH/bin:$GOROOT/bin:$PATH
Bước 02: Sử dụng SNMP Exporter Config Generator biên dịch và download mibs.
Cài đặt một số package cần thiết.
sudo yum install git zip unzip gcc gcc-g++ make net-snmp net-snmp-utils net-snmp-libs net-snmp-devel # RHEL-based distrosSử dụng go get để download generator về
go get github.com/prometheus/snmp_exporter/tree/master/generatorThực hiện biên dịch và download mibs từ tool generator, đối với những loại mibs ko có sẵn trong này, bạn phải download từ hãng về và bỏ thư mục chứa các mibs.
cd ${GOPATH-$HOME/go}/src/github.com/prometheus/snmp_exporter/generator
go build
make mibs
Mibs của những thiết bị sẽ được download và copy tới đường dẫn sau
${GOPATH-$HOME/go}/src/github.com/prometheus/snmp_exporter/generator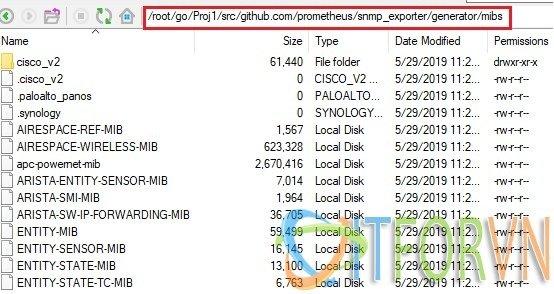
Hình 01: [Promethues từ A đến Z] Phần 03. Giám sát firewall Fortigate qua snmp
Bước 03: Generate file snmp.yml để có thể giám sát thiết bị mạng (tại đây mình giám sát thiết bị firewall Fortigate)
Vì trong thư mục mibs download ở trên không có mibs của Fortigate. Vì thế mình phải download mib của fortigate về và bỏ vào đường dẫn. ${GOPATH-$HOME/go}/src/github.com/prometheus/snmp_exporter/generator/mibs
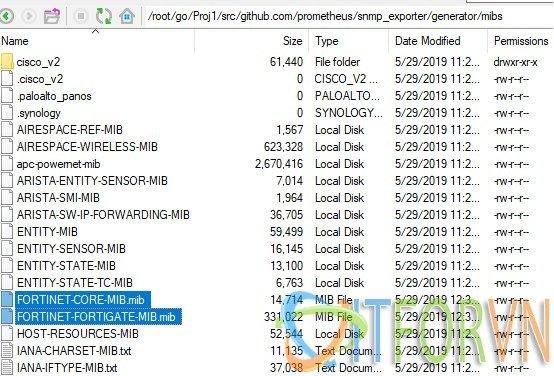
Hình 02: [Promethues từ A đến Z] Phần 03. Giám sát firewall Fortigate qua snmp
Đối với mibs của Fortigate thì các bạn download như sau: Login vào Fortigate, vào System, vào SNMP và chọn download mibs về.
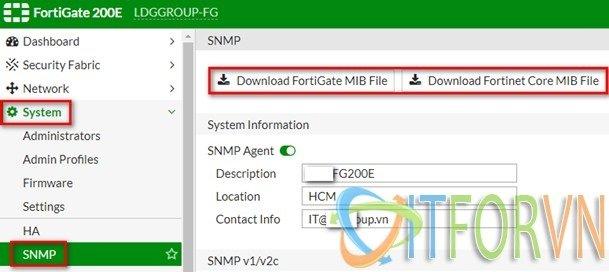
Hình 03: [Promethues từ A đến Z] Phần 03. Giám sát firewall Fortigate qua snmp
Các bạn cũng có thể tìm trên mạng với những mib của các thiết bị khác.
Bước 04: Để prometheus có thể thu thập được metric của Fortigate bạn phải enable snmp trên firewall Fortigate. Chúng ta login vào Fortigate, SNMP, sau đó create snmp v2 (mình ko sử dụng snmp v3) như hình sau:
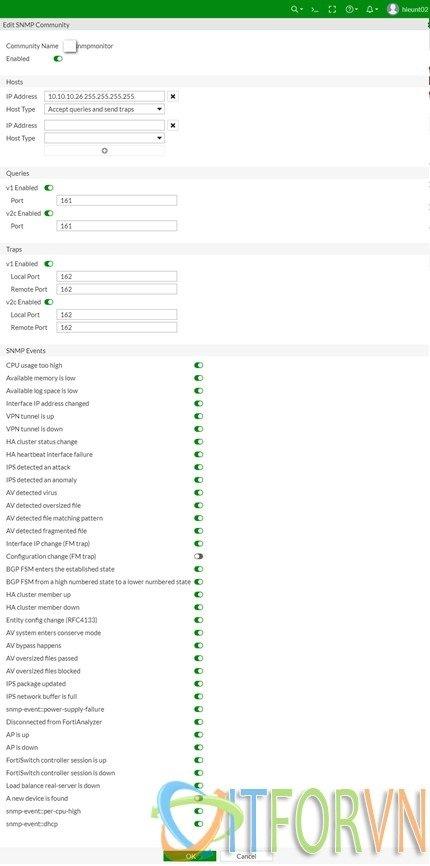
Hình 04: [Promethues từ A đến Z] Phần 03. Giám sát firewall Fortigate qua snmp
Khi tạo snmp chúng ta cần chú ý các tham số sau:
Community name :là tên mà bạn sẽ khai báo trong file gernagator.yml
IP address: là IP của prometheus server.
Bước 05: Edit file generator.yml và thêm module foritgate. Mặc định file generator.yml có rất nhiều thông tin trong này, chúng ta khuyến khị chỉ sử dụng những thông tin liên quan đến thiết bị cần monitor.
nano go/src/github.com/prometheus/snmp_exporter/generator/generator.ymlmodules:
########## Fortigate
fortigate_snmp:
walk:
- ifXTable
- fgVpn
- fgSystem
- fgIntf
version: 2
max_repetitions: 25
retries: 3
timeout: 10s
auth:
community: publicTrong đó chúng ta cần chú ý các tham số sau:
fortigate_snmp là tên module.
ifXTable, fgVpn, fgSystem, fgIntf là các tham số OID.
version:2 là snmpv2.
community: communityname là community name khi enable trong Fortigate.
Tiếp tục sau đó export mibs và generate ra file snmp.yml
export MIBDIRS=mibs
./generator generate
Như vậy chúng ta đã có file snmp.yml
Bước 06: Cài đặt smnp_exporter lên prometheus server
Link download source snmp_exporter tại đây: https://github.com/prometheus/snmp_exporter/releases
Sử dụng comment wget để download trực tiếp
wget https://github.com/prometheus/snmp_exporter/releases/download/v0.15.0/snmp_exporter-0.15.0.linux-amd64.tar.gzGiải nén và copy source đến thư mục /usr/local/snmp_exporter
tar -xvzf snmp_exporter-0.15.0.linux-amd64.tar.gz
mv snmp_exporter* /usr/local/snmp_exporter
Tạo service trong systemd cho snmp_exporter
vi /etc/systemd/system/snmp_exporter.serviceNôi dung file snmp_exporter.service như sau:
[Unit]
Description=Snmp_exporter
Wants=network-online.target
After=network-online.target

[Service]
User=root
Group=root
Type=simple
ExecStart=/usr/local/snmp_exporter/snmp_exporter \
--config.file=/usr/local/snmp_exporter/snmp.yml

[Install]
WantedBy=multi-user.target
Bước 07: Copy file snmp.yml đến thư mục source của snmp_exporter
cp -R /root/go/src/github.com/prometheus/snmp_exporter/generator/snmp.yml /usr/local/snmp_exporter/Restart và enable service
systemctl restart snmp_exporter.service
systemctl status snmp_exporter.service
systemctl enable snmp_exporter.service
Bước 08: Kiểm tra metric
Snmp_exporter chạy trên port 9116 vì vậy chúng ta cần phải mở port này trên promethues server.
Truy cập vào https://ipprometheus:9116 và điền các thông tin sau:
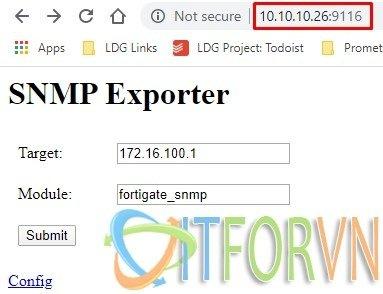
Hình 05: [Promethues từ A đến Z] Phần 03. Giám sát firewall Fortigate qua snmp
Target: là ip của fortigate
Module: chính là module mà bạn tạo bằng generator cho fortigate
Nếu thấy có metric là OK.
Bước 09: Tạo job trong prometheus để giám sát Fortigate với nội dung job sau:
vi /usr/local/prometheus/prometheus.ymlNội dung chúng ta sẽ bỏ vào promethues.yml như sau
################################ FORTIGATE
  - job_name: 'fortigate'
    static_configs:
      - targets:
        - 172.16.100.1 # fortigate device.
        labels:
         hostname: GROUP-FG
         device: fortigate
         company: ITFORVN
    scrape_interval: 3m
    scrape_timeout : 3m
    metrics_path: /snmp
    params:
      module: [fortigate_snmp]
    relabel_configs:
      - source_labels: [__address__]
        target_label: __param_target
      - source_labels: [__param_target]
        target_label: instance
      - target_label: __address__
        replacement: 10.10.10.98:9116  # SNMP exporter.
Restart prometheus service
service prometheus restartĐể kiểm tra lại kết quả, bạn truy cập vào prometheus / targets
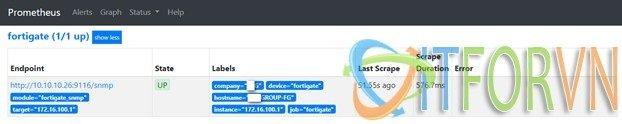
Hình 06: [Promethues từ A đến Z] Phần 03. Giám sát firewall Fortigate qua snmp
Bước 10: Bây giờ chúng ta sẽ tạo dashboard để giám sát Fortigate bằng cách truy cập vào Grafana để import dashboard có sẳn.
Cách tạo dashboard mình có hướng dẫn tại Bước 09 trong bài viết này.
Đây là dashboard sau khi đã import vào.
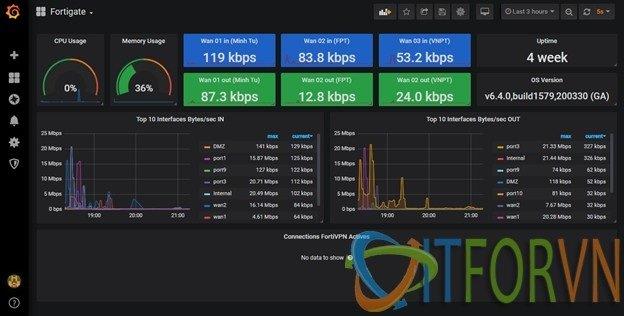
Hình 07: [Promethues từ A đến Z] Phần 03. Giám sát firewall Fortigate qua snmp
Các bạn có thể sử dụng dashboard đã edit của mình tại link này.
Hoặc download các dashboard tùy ý thích tại link này.
Nguồn tham khảo:
https://github.com/prometheus/snmp_exporter
https://grafana.com/grafana/dashboards/7567
Bài viết chỉ mang tính chất tham khảo và chia sẻ, các trong quá trình làm chắc chắn sẽ có bạn gặp bug. Nếu gặp bug thì vào telegram group ITFORVN để nhờ support từ cộng đồng. Hoặc các bạn thể có truy cập vào nguồn tham khảo để làm theo hướng dẫn chính thống. Ngoài ra bạn có thể tham gia Forum Google [prometheus-users] của nước ngoài để hỏi đáp.
Tác giả: Nguyễn Hiếu – ITFORVN.COM
To you support to access: Nhóm Facebook ITFORVN
Tất cả bài viết về prometheus tại đây.
Giới thiệu về giải pháp giám sát hệ thống Prometheus và Grafana
Phần 01 – Cài đặt Prometheus và Grafana trên CentOS 07
Phần 02 – Giám sát Windows Server với Prometheus
Phần 03 – Giám sát firewall Fortigate với Prometheus
Phần 04 – Giám sát thiết bị mạng Cisco với Prometheus
Phần 05 – Giám sát firewall pfSense® và Linux Server với Prometheus
Phần 06 – Giám sát VMWARE với Prometheus
Phần 07 – Cấu hình alert trong Prometheus và gửi tin nhắn qua telegram