
[Prometheus từ A đến Z] Phần 01. Cài đặt Prometheus và Grafana trên CentOS 7
Bài viết chỉ mang tính chất tham khảo và chia sẻ, các trong quá trình làm chắc chắn sẽ có bạn gặp bug. Nếu gặp bug thì vào telegram group ITFORVN để nhờ support từ cộng đồng. Hoặc các bạn thể có truy cập vào nguồn tham khảo để làm theo hướng dẫn chính thống. Ngoài ra bạn có thể tham gia Forum Google [prometheus-users] của nước ngoài để hỏi đáp.
Lời đầu tiên mình xin lỗi tất cả vì không thể lên bài như đúng hẹn được, do thời gian này mình khá bận với công việc. Mình mong mọi người thông cảm và tiếp tục đồng hành cùng gia đình ITFORVN.
Tiếp nối thành công của khóa học Docker từ Mr Tấn, mình sẽ ứng dụng thực tế docker và hệ thống monitoring này, để mọi người có thể được trải nghiệm cách làm việc với container, images, …
Trong bài này mình sẽ hướng dẫn các bạn cài đặt Prometheus và Grafana bằng 2 cách.
Cách 01: Cài đặt Prometheus bằng Docker.
Cách 02: Cài đặt Prometheus bằng Package.
I. Cấu hình chung cho hệ thống trước khi bạn cài đặt Prometheus:
- Update linux, sync NTP linux, disables selinux
Chạy lệnh :
yum update -y
ntpdate 1.ro.pool.ntp.org
vim /etc/sysconfig/selinux
Change “SELINUX=enforng” to “SELINUX=disabled”.
Save và exit file. Sau đó reboot lại server.
- Cài iptables thay thế cho firewalld trên Centos 7
=> Do mình thích sử dụng iptables hơn là firewalld.
Bước 1: remove firewalld
systemctl stop firewalld
systemctl disable firewalld
systemctl mask --now firewalld
Bước 2: Cài đặt Iptables
yum install iptables-services -y
systemctl start iptables
systemctl enable iptables
Mở các port sau:
-A INPUT -p tcp -m state --state NEW -m tcp --dport 22 -j ACCEPT
-A INPUT -p tcp -m state --state NEW -m tcp --dport 3000 -j ACCEPT
-A INPUT -p tcp -m state --state NEW -m tcp --dport 9090 -j ACCEPT
II. Cài đặt prometheus bằng Docker
- Cài đặt Docker
Link tham khảo: https://docs.docker.com/install/linux/docker-ce/centos/
Bước 1: Cài các gói cần thiết
sudo yum install -y yum-utils device-mapper-persistent-data lvm2Bước 2: Cấu hình docker-ce repo
sudo yum-config-manager \
    --add-repo \
    https://download.docker.com/linux/centos/docker-ce.repo
Bước 3: Cài đặt docker-ce
sudo yum install docker-ce docker-ce-cli containerd.io
systemctl enable docker
systemctl restart docker
Check docker version
docker vesion- Cài đặt prometheus với docker
Có 2 cách:
Cách 1: Bạn có thể pull trực tiếp image về và dùng
Search Images:
docker search prometheusThông tin Image trực tiếp từ trang chủ: https://hub.docker.com/u/prom
Bước 1: Tải image về:
docker search prometheusBước 2: Run docker với image mình đã pull về
docker run --restart=always --mount source=prometheus-data,target=/prometheus --mount source=prometheus-config,target=/etc/prometheus --name prometheus -d -p ip-prometheus:9090:9090 prometheusCách 2 (khuyến nghị): Git clone code về sau đó build image
=> Cách này có thể kiểm soát dc code
Dùng git clone để download code về local
git  clone https://github.com/prometheus/prometheus
cd prometheus/
Sử dụng Go Lang để build file config của prometheus (binary)
make buildEdit Dockerfile -> check xem Dockerfile
Ở đây mình check thấy đường dẫn không đúng và mình chỉnh lại cho phù hợp
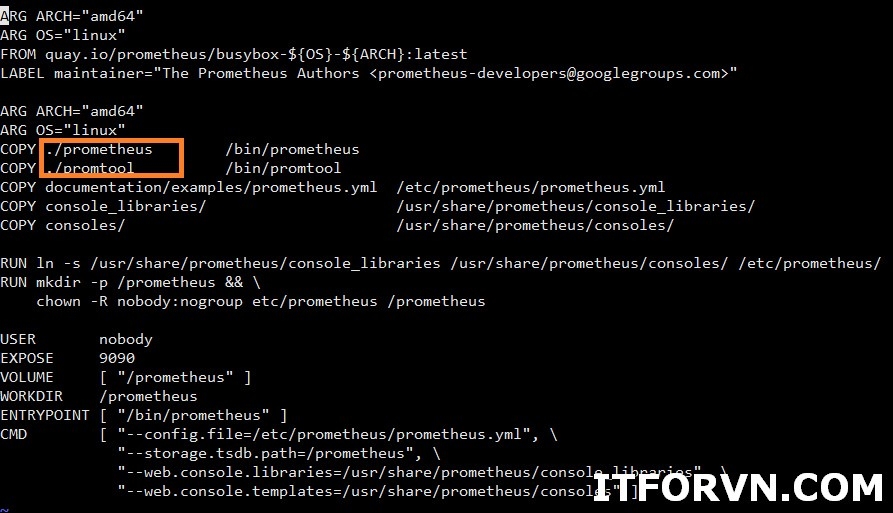
Hình 01. [Monitor System từ A đến Z] Phần 01. Cài đặt Prometheus và Grafana trên CentOS 7
Build Image:
dcker image build -t prometheus:latest .Run Image sau mình đã build
docker run --restart=always --mount source=prometheus-data,target=/prometheus --mount source=prometheus-config,target=/etc/prometheus --name prometheus -d -p 9090:9090 prometheusCheck lại kết quả image đang chạy:
docker ps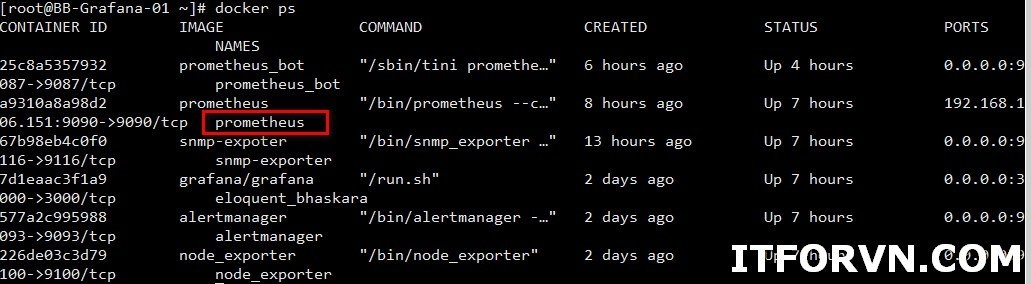
Hình 02: [Monitor System từ A đến Z] Phần 01. Cài đặt Prometheus và Grafana trên CentOS 7
Truy cập vào Prometheus: http://IP:9090
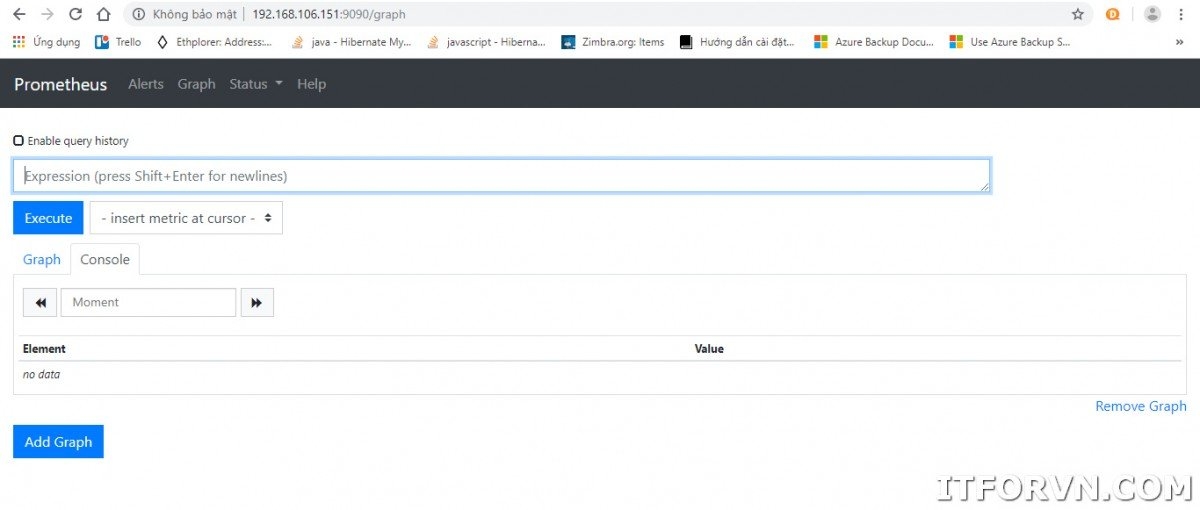
Hình 03: [Monitor System từ A đến Z] Phần 01. Cài đặt Prometheus và Grafana trên CentOS 7
Note :
docker run: lệnh dùng để chạy docker
–restart=always: khởi động lại image sau khi docker start lại
. tượng trưng cho thư mục hiện tại chứa Dockerfile
–mount source=prometheus-data,target=/prometheus: kỹ thuật dùng mount data tránh mất datda khi mình xóa container
Thường mình sẽ inspect image ra để xem nên mount những thư mực nào.
docker image inspect prometheus
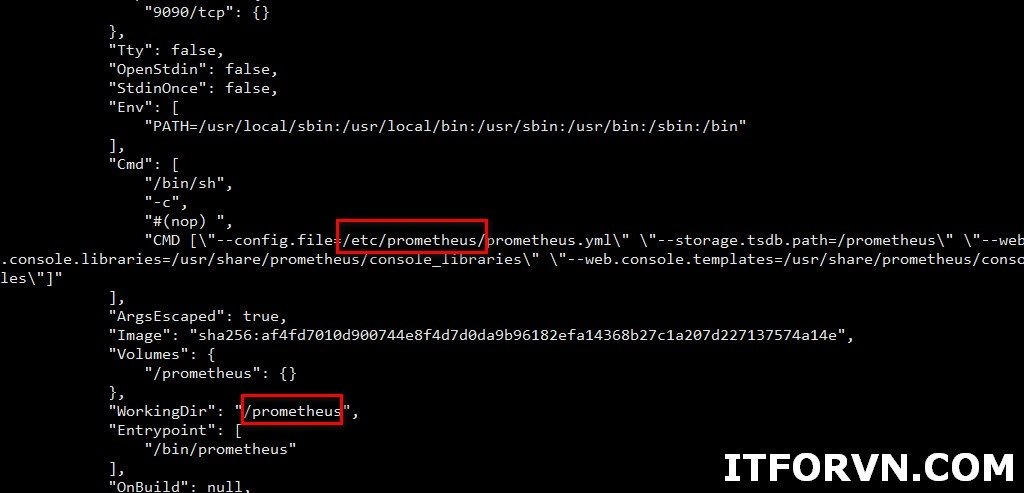
Hình 04: [Monitor System từ A đến Z] Phần 01. Cài đặt Prometheus và Grafana trên CentOS 7
=> Nhìn hình mình sẽ cần mount Workingdir và thư mực chức file config chính.
-d -p 9090:9090: Nat port bên ngoài vào port container
- Cài đặt grafana
Bước 1: Pull image grafana về local
docker pull grafana/grafanaBước 2: Run image grafana
docker run --restart=always -d -p 3000:3000 grafana/grafana => Mình không mount thư mực vì mình check image không có gì đễ lưu
Truy cập vào Grfana: http://IP:3000
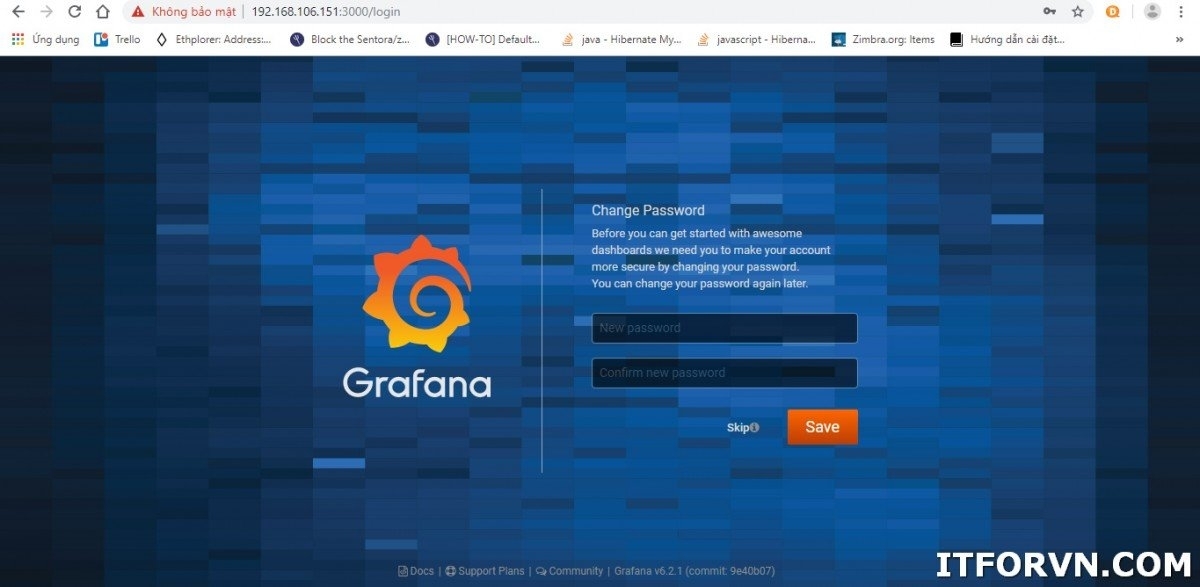
Hình 05: [Monitor System từ A đến Z] Phần 01. Cài đặt Prometheus và Grafana trên CentOS 7
=> Passwork mặt định là admin/admin, và sau đó sẽ đổi password sau lần đầu tiên đăng nhập
Bước 3: Connect Grafana tới prometheus
Chọn Configuration, sau đó chọn data source type là Prometheus
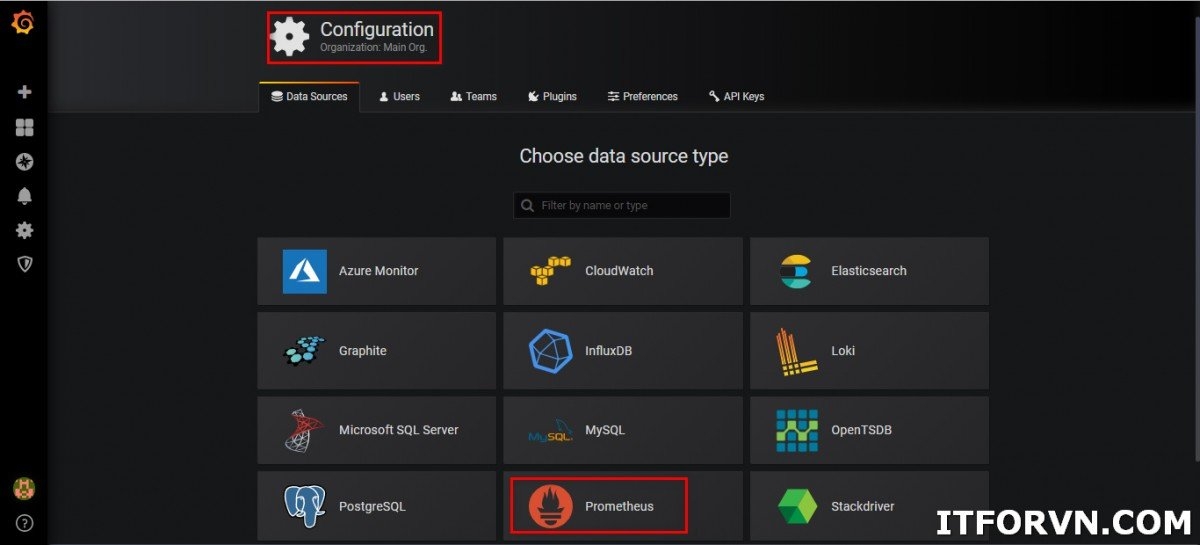
Hình 06: [Monitor System từ A đến Z] Phần 01. Cài đặt Prometheus và Grafana trên CentOS 7
Nhập thông tin của prometheus, sau đó save lại.
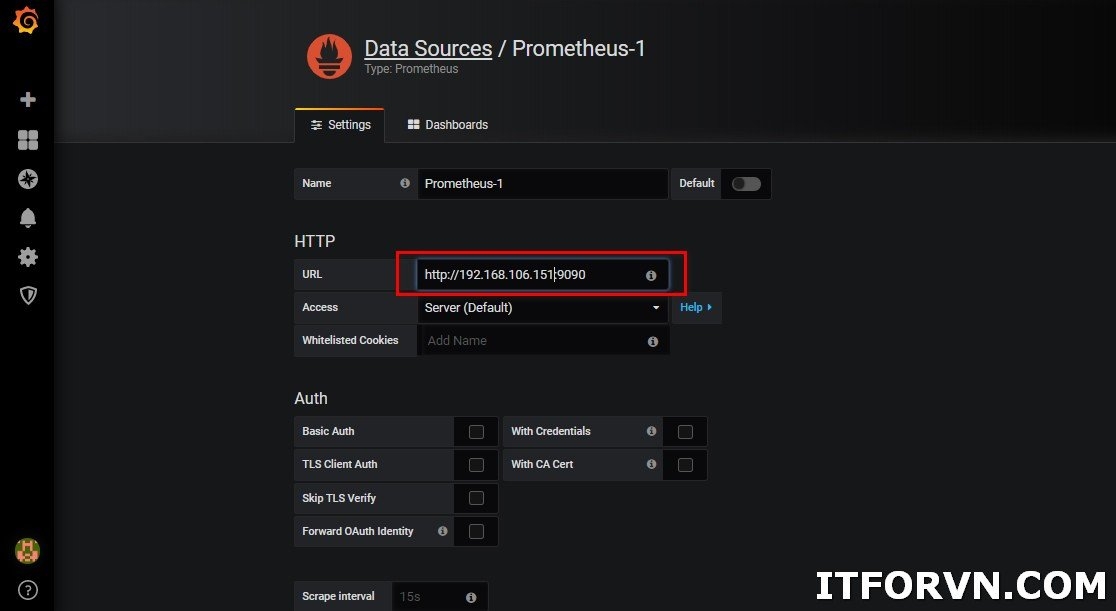
Hình 07: [Monitor System từ A đến Z] Phần 01. Cài đặt Prometheus và Grafana trên CentOS 7
=> Như vậy chúng ta đã hoàn thành việc kết nối giữa Grafana và Prometheus
II. Cài đặt Prometheus bằng Package
- Cài đặt prometheus
Download here: https://prometheus.io/download/
wget https://github.com/prometheus/prometheus/releases/download/v2.10.0/prometheus-2.10.0.linux-amd64.tar.gz
tar -xvzf prometheus-2.10.0.linux-amd64.tar.gz
mv prometheus-2.10.0.linux-amd64 /usr/local/prometheus/
Tạo service prometheus trong systemd
vim /etc/systemd/system/prometheus.serviceNội dung file là:
[Unit]
Description=Prometheus
Wants=network-online.target
After=network-online.target

[Service]
User=root
Group=root
Type=simple
ExecStart=/usr/local/prometheus/prometheus \
--config.file /usr/local/prometheus/prometheus.yml \
--storage.tsdb.path /usr/local/prometheus/ \
--web.console.templates=/usr/local/prometheus/consoles \
--web.console.libraries=/usr/local/prometheus/console_libraries

[Install]
WantedBy=multi-user.target
Restart và enable services.
systemctl daemon-reload
systemctl start prometheus
systemctl status prometheus- Cài đặt Grafana
https://grafana.com/grafana/download
wget https://dl.grafana.com/oss/release/grafana-6.2.1-1.x86_64.rpm
sudo yum localinstall grafana-6.2.1-1.x86_64.rpm
sudo service grafana-server start
sudo /sbin/chkconfig --add grafana-server
systemctl daemon-reload
systemctl start grafana-server
systemctl status grafana-server
sudo systemctl enable grafana-server.service
Truy cập vào Grfana: http://IP:3000
Hình 08: [Monitor System từ A đến Z] Phần 01. Cài đặt Prometheus và Grafana trên CentOS 7
Sau bài này mình sẽ tiếp tục hướng dẫn mọi người đưa các thiết bị vào để monitor. Ví dụ như Server Windows, Server Linux và monitor những thiết bị mạng qua snmp.
Bài viết chỉ mang tính chất tham khảo và chia sẻ, các trong quá trình làm chắc chắn sẽ có bạn gặp bug. Nếu gặp bug thì vào telegram group ITFORVN để nhờ support từ cộng đồng. Hoặc các bạn thể có truy cập vào nguồn tham khảo để làm theo hướng dẫn chính thống. Ngoài ra bạn có thể tham gia Forum Google [prometheus-users] của nước ngoài để hỏi đáp.
Tác giả: Nguyễn Hiếu – ITFORVN.COM
To you support to be access : Nhóm Facebook ITFORVN
Tất cả bài viết về prometheus tại đây.
Giới thiệu về giải pháp giám sát hệ thống Prometheus và Grafana
Phần 01 – Cài đặt Prometheus và Grafana trên Centos 07
Phần 02 – Giám sát Windows Server với Prometheus
Phần 03 – Giám sát firewall Fortigate với Prometheus
Phần 04 – Giám sát thiết bị mạng Cisco với Prometheus
Phần 05 – Giám sát firewall Pfsense và Linux Server với Prometheus
Phần 06 – Giám sát VMWARE với Prometheus
Phần 07 – Cấu hình alert trong Prometheus và gửi tin nhắn qua telegram